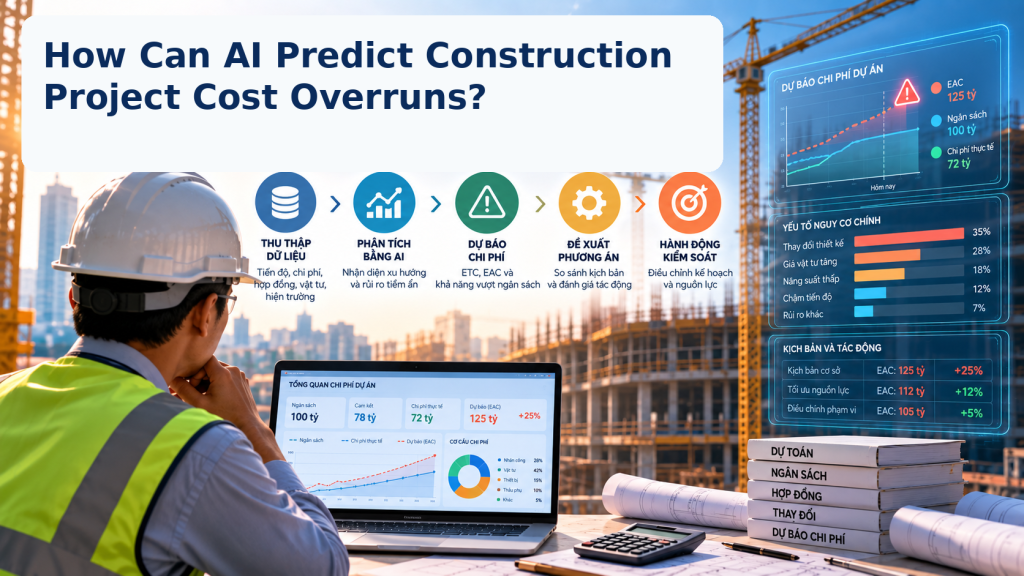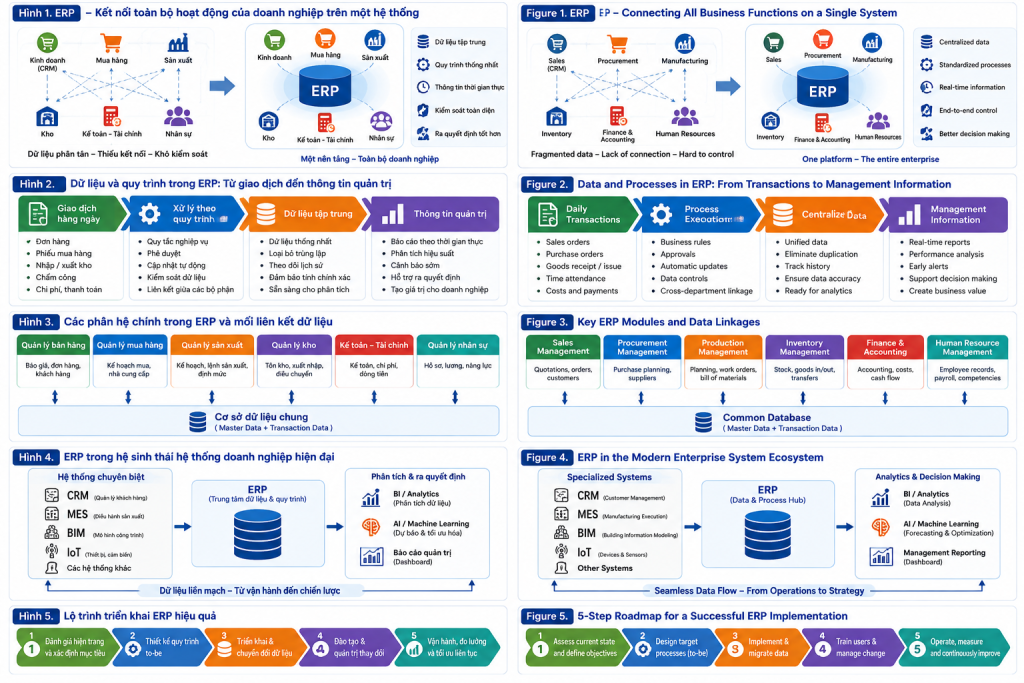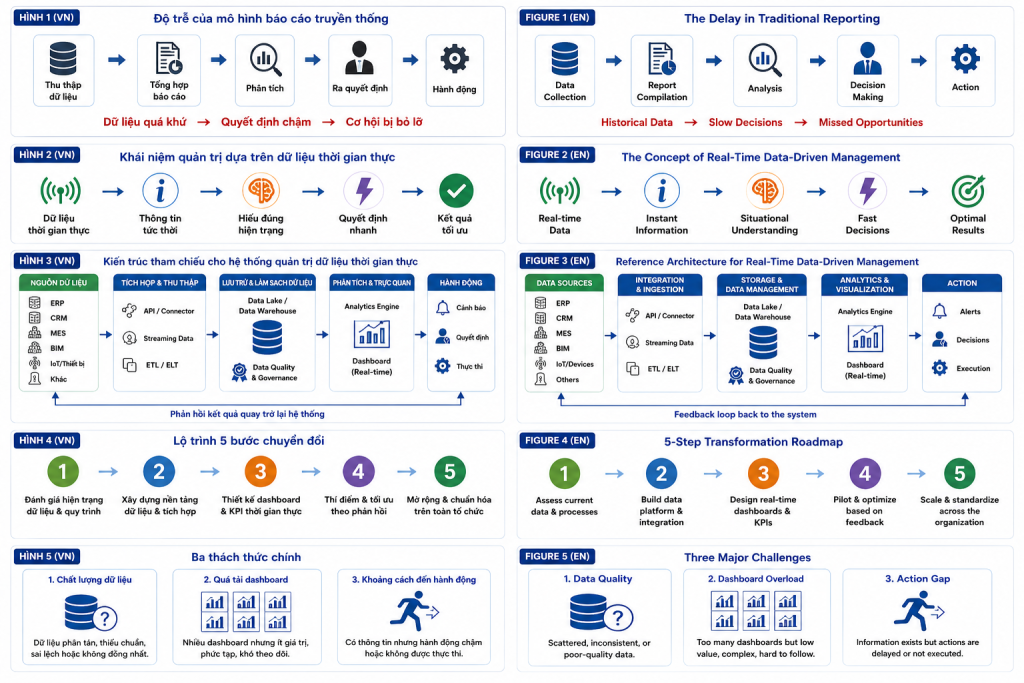

A construction site can appear well stocked and still face a shortage at the workface. Article “Construction Material Management: Controlling Demand, Supply, Inventory and Consumption” explained how demand, procurement, acceptance, inventory and consumption must be connected. The next question is whether impending imbalances can be detected weeks before they interrupt execution. AI can help, provided its predictions reflect remaining work, need-by dates and material that is genuinely available for use.
1. From material control to forecasting construction readiness
Article “Construction Material Management: Controlling Demand, Supply, Inventory and Consumption” established an essential distinction: material recorded in inventory is not necessarily material available for a specific activity. Forecasting must preserve that distinction. If a system knows only the book balance, but not specification, acceptance status, location or reservations, artificial intelligence (AI) may predict a number that has little operational meaning.
The relevant management question is not simply how much material will leave the warehouse next month. It is how much each work package will require in each upcoming period, what quantity will be usable at the required location and date, and which activities may be affected by a shortage. Forecasting therefore belongs within construction execution planning rather than within an isolated inventory reporting function.
AI becomes valuable when it detects changing conditions early: crews accelerating, drawings revising quantities, suppliers slipping or inspection taking longer than expected. Such signals can invalidate a procurement plan that was reasonable only days earlier.
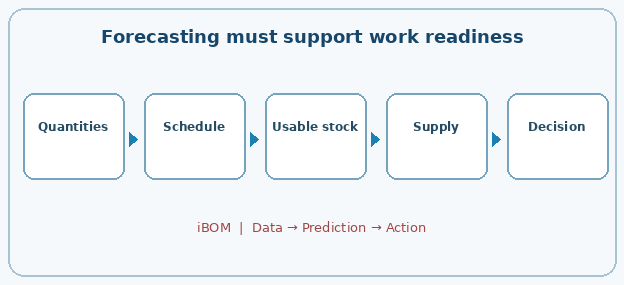
Figure 1. Forecasting must support work readiness
2. Construction demand is not conventional retail demand
Many inventory forecasting methods assume recurring sales patterns. A construction project progresses through distinct stages, locations and work packages. Structural steel demand may fall as the structure is completed, while demand for pipework, cables and finishing materials rises. Extrapolating average issues from previous months can therefore create systematic errors.
The starting point should be remaining work quantities, approved design, construction methods and scheduled execution. Historical consumption helps calibrate allowances and variability; it cannot replace information about future work. A design quantity of 1,000 meters of pipe does not necessarily mean exactly 1,000 meters must be purchased, because cutting, routing changes, recoverable stock and previously issued material all matter.
A practical solution combines rule-based quantity calculations with models that estimate uncertainty. The baseline comes from work quantities and norms; AI then estimates variation associated with productivity, design change, approval delays and comparable execution histories. This hybrid approach is more auditable than delegating the entire calculation to an opaque model.
3. The data foundations of a reliable forecast
The first data layer describes work: activity identifiers, locations, remaining quantities, planned dates, dependencies and workface readiness. The second captures execution: material norms, crew productivity, installed quantities, confirmed waste and unused material already issued to site teams.
The third describes supply: purchase orders, manufacturing milestones, promised dates, supplier reliability, transport time and acceptance duration. The fourth identifies genuinely usable inventory by item, specification, batch, location and reservation. Contextual records—design revisions, access restrictions, weather disruption and resequencing decisions—complete the picture.
Connectivity matters more than the number of fields. If warehouse item codes cannot be mapped to estimated quantities, or schedules do not identify the work location, the system cannot identify where a shortage will occur. Standardizing identifiers, units, drawing revisions and update timestamps often delivers more immediate value than selecting a sophisticated algorithm.
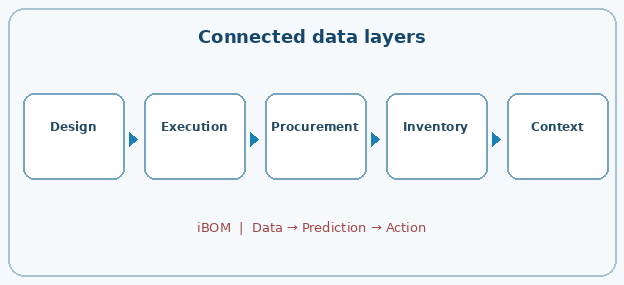
Figure 2. Connected data layers
4. How AI converts early signals into a demand forecast
A model can learn how demand changes in response to observable leading indicators. Once access is released, crews increase and predecessor activities finish, material consumption may accelerate beyond the original plan. Conversely, unresolved technical submissions or unavailable workfaces can defer demand despite a schedule showing an imminent start.
Time-series methods, regression and machine learning can supplement quantity-based calculations. Frequently consumed materials may have useful weekly patterns. For bespoke equipment, however, the central challenge is often not forecasting quantity but estimating whether the item will become available by its need-by date. Manufacturing and approval milestones matter more than a generic demand curve.
A responsible forecast should report an expected quantity, an uncertainty range and the factors driving change. A prediction of 500 meters of cable next week is a conditional estimate based on the current execution plan, not a guaranteed requirement.
5. Translating demand forecasts into time-phased shortage risk
Demand forecasting is only half of the problem. The other half is matching period-specific demand against opening usable stock and inbound quantities likely to become available on time. A shipment arriving Friday cannot support work beginning Monday; delivered material awaiting acceptance cannot be counted as immediately usable.
A rolling weekly balance should update opening stock, accepted receipts, planned consumption and closing availability. AI may estimate delivery reliability or inspection duration from supplier history and project conditions, but uncertain arrivals should be represented as uncertain rather than silently added to available stock.
When a gap appears, the system should identify the affected activity and milestone. A low-cost fitting that blocks critical work can deserve more attention than a costly item not needed for several weeks. Quantity shortfall becomes meaningful only when combined with the operational consequence of the shortfall.
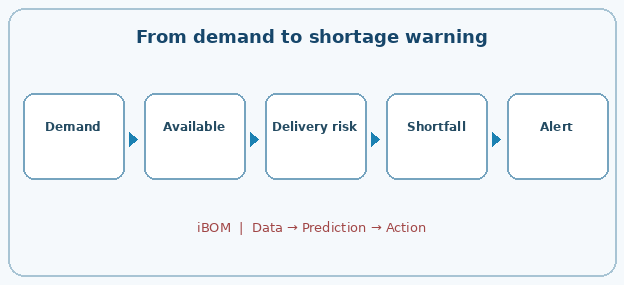
Figure 3. From demand to shortage warning
6. Inventory reduction is not an objective at any cost
Buying early and buying more may provide reassurance, but it ties up working capital, occupies storage, increases handling and creates damage exposure. Buying too little can idle crews and trigger expensive recovery measures. The management objective is therefore a risk-appropriate buffer, not the lowest possible stock curve.
AI can help estimate demand variation and replenishment uncertainty to suggest buffers by material category. Reorder points may suit common goods; long-lead engineered equipment requires milestone control and contingency planning; transferable stock requires analysis of transport cost and the risk imposed on the sending project.
Any buffer recommendation must reflect schedule criticality, substitutability, capital cost, storage conditions and data reliability. A proposed 20 percent inventory reduction is valuable only if the required level of material readiness is maintained.
7. Turning forecasts into procurement and transfer decisions
An alert that offers no practical response has limited value. When a shortage is forecast three weeks ahead, management needs to compare feasible alternatives: additional purchasing, split deliveries, inter-site transfers, work resequencing or technically approved substitutions.
Each option carries constraints and costs. Expedited orders can be expensive; transfers may deprive another project; resequencing can disrupt crews and inspections; substitutions must satisfy design and quality requirements. AI can help screen and rank alternatives, but hard rules for technical compliance, budgets and approvals must remain explicit.
A useful recommendation identifies the expected shortage, its date, affected work package, principal drivers, feasible responses, estimated consequences and accountable decision-maker. Once an action is taken, its result should feed back into the forecasting and control process.
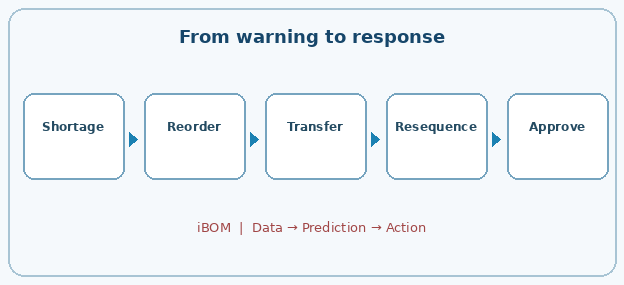
Figure 4. From warning to response
8. Illustrative scenario: identifying a cable shortage before crews stop
Consider a project planning to install 2,400 meters of cable over four weeks: 400, 600, 800 and 600 meters respectively. The site has 1,100 meters of usable stock, another 500 meters awaiting acceptance, and a 1,000-meter purchase order promised at the start of week three. These numbers are illustrative, not measured industry data.
A simple total of 2,600 meters might suggest adequate supply. Yet the first two weeks consume 1,000 meters, leaving only 100 meters available. If the 500-meter lot remains unaccepted and the inbound order is delayed, week three faces a shortfall of up to 700 meters against its 800-meter requirement. A useful forecast identifies that exposure before the crew reaches the affected activity.
If supplier history suggests late delivery and acceptance may take an additional week, the system should present on-time, delayed-delivery and delayed-inspection scenarios. Management can accelerate acceptance documentation, reconfirm delivery, arrange an approved transfer or resequence work. The benefit is the additional time to respond, not the appearance of perfect numerical prediction.
9. Measuring operational value rather than accuracy alone
A model can have low forecast error and still be useless if it detects a shortage only one day before work stops. Conversely, a somewhat uncertain early warning can be highly valuable if it enables timely procurement or transfer. Evaluation must therefore include both predictive performance and the outcomes of decisions.
Technical measures can include forecast error by material and horizon, correctly identified shortages, false alerts and the reliability of prediction intervals. Aggregating all materials into one accuracy score is misleading because recurring consumables and bespoke equipment behave differently.
Operational measures are more decisive: warning lead time, on-time material readiness, crew waiting hours, average inventory value, emergency purchase costs and the proportion of recommendations acted upon. The system has demonstrated value only when these outcomes improve without simply shifting risk elsewhere.
10. Limits and governance requirements
Historical records may encode flawed practices: issues assigned to the wrong activity, stale balances, overwritten delivery dates or untracked revisions. Training directly on such data risks reproducing poor control rather than improving it.
Major design changes, unusual market conditions and new construction methods can make historical relationships unreliable. Forecast quality must be monitored over time, and significant changes should trigger review. Training must also avoid using information that was unavailable at the original prediction date, since this creates deceptively strong back-test results.
AI should not independently issue high-value purchase orders or authorize technical substitutions on the strength of a forecast alone. Contract conditions, approval authority, budgets and design compliance remain binding. The system supports accountable human decisions rather than replacing them.
11. Architecture for connected prediction and action
A practical system can integrate schedule, quantity takeoff, procurement, stores, quality acceptance and site reporting. Shared identifiers for material, activity, location and time support a rolling demand-and-supply balance. Forecasting services then estimate demand variation, delivery reliability and shortage exposure.
A decision-support layer evaluates forecasts against technical rules, budget constraints and transfer conditions. The final layer is an operational workflow: who validates the alert, who selects an intervention, who approves it and who records the outcome. Without this step, even an excellent dashboard cannot ensure that a detected problem is resolved.
For iBOM or a comparable project-management platform, the appropriate architecture builds on existing business objects rather than creating another disconnected data repository. AI should serve as a predictive and advisory layer over controlled procurement, inventory and acceptance processes.
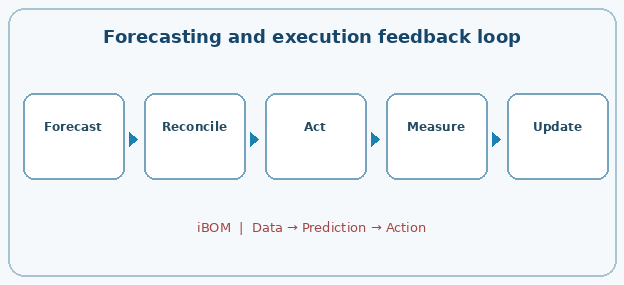
Figure 5. Forecasting and execution feedback loop
12. A phased implementation grounded in site operations
A pilot should begin with a material category that has regular demand, reliable identifiers and clear schedule consequences, such as electrical cables, pipework or location-based finishing materials. Teams should reconcile usable inventory, identify true demand history, standardize lead times and link requirements to weekly work plans.
Next, establish a transparent baseline forecast from remaining quantities and material norms, then compare it with a model incorporating field signals. Run the AI in parallel with existing planning, documenting correct warnings, false alerts and interventions. Expansion should follow evidence that warnings arrive early enough to reduce actual work disruption.
Once data and routines stabilize, the enterprise can extend forecasting across projects, recommend inter-site transfers and tune inventory buffers by risk. This is the transition from isolated demand prediction to data-driven construction supply-chain management.
Conclusion
AI does not automatically reduce inventory or replace material managers. Its value lies in connecting work quantities, schedules, consumption, usable stock and supply reliability to identify shortages and excess before they become operational problems. Only when forecasts lead to controlled actions and measured outcomes can projects reduce working capital without sacrificing work readiness.
The starting point is not the most advanced algorithm, but trustworthy data and an accountable response process. Forecasting becomes a management capability only when it creates enough time to act.
Professional references and conceptual foundations
- Construction Industry Institute (CII) – construction materials management and project supply-chain practices.
- Project Management Institute (PMI) – project procurement, resource and risk management principles.
- AACE International – cost, quantity and forecasting practices.
- Numerical examples are illustrative scenarios developed for this article, not empirical industry statistics.
- Digital Transformation Is Failing Because Companies Focus on Tools, Not Execution
- In the AI Era, Management Power Lies in Execution Data
- AI Agent in iBom Mobile
- Execution Infrastructure — The Missing Foundation of Modern Enterprise Execution
- Autonomous Organization — When the System Starts to Run Itself